I have been thinking a lot lately about the connection between progress monitoring and the Seneca value of HOPE. Sounds strange, I know. But here is the thing – the work we do in partnership with schools is challenging to say the least. We are supporting change in student behavior and change in school-wide systems – both of which are slow, often non-linear journeys. In the process of reshaping student behavior and improving school wide culture and climate, sometimes start with ambitious and ambiguous goals that lack a clearly articulated plan for promoting the changes necessary to achieve them. Without a roadmap, we become convinced we’re going no-where at all - we often lose hope and give up along the way, telling ourselves that, “we just can’t help this difficult student,” or “this school-wide initiative won’t work here.”
Setting concrete, measurable goals, progress monitoring, and celebrating milestones is one way that we can help school teams to understand that things are in fact improving overtime and that there is reason to hold on to hope. I recently came across an impressive example of progress monitoring while preparing for a tour at Verde Elementary in Richmond. In reflecting on their office discipline referral (ODR) data (graph below), I noticed three encouraging trends:
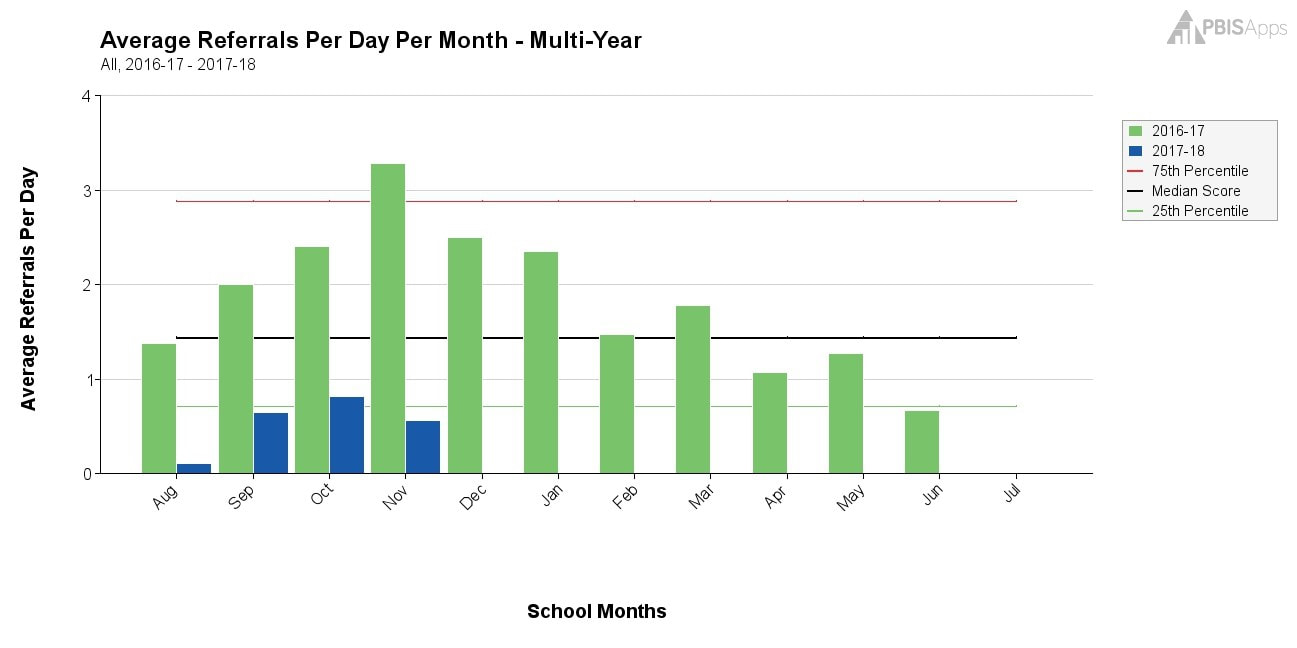
Setting concrete, measurable goals, progress monitoring, and celebrating milestones is one way that we can help school teams to understand that things are in fact improving overtime and that there is reason to hold on to hope. I recently came across an impressive example of progress monitoring while preparing for a tour at Verde Elementary in Richmond. In reflecting on their office discipline referral (ODR) data (graph below), I noticed three encouraging trends:
- During the first year of our UE partnership (2016-17 school year), ODRs steadily decreased from November to the end of the year in June, creating the beautiful downward slope that we would hope to see
- When you compare last year (2016-17) to this school year (2017-18) there is an overall, significant decrease in the number of ODRs each month
- And last, when you look at national trends (horizontal lines on the graph), Verde is in fact BELOW THE 25th PERCENTILE for the number of ODRs experienced by students every month.
 Connor Crabb, Student Support Assistant
 This data is impressive. When a district representative on the tour saw this graph she immediately named a handful of people she wanted to go and share it with – she was excited to share this evidence of impact of the UE model. I was similarly excited to see the progress laid out so beautiful in an objective graph – but I wasn’t surprised. This is the kind of progress that is possible when school teams commit to regularly analyzing data to make intervention decisions. I had heard great stories about how Verde was doing this at their school.
For example, after noticing that 40% of referrals during the 2016-2017 school year came from the playground, the team made a focused effort to create more structure and support at recess. Connor Crabb, a Seneca team member who joined the partnership this school year has supported this effort and the results are inspiring. During the first three months of school this year, students have experienced a 70% reduction in ODRs from the playground compared to the same time period last year (58 referrals vs. 17 referrals).
I know this kind of data-based decision making is happening throughout out programs – at the student intervention level as well as the school-wide level. What I hope is that we are using our progress monitoring to celebrate success and foster this sense of excitement and persistence that we know is necessary in this work. I look forward to hearing more stories about how data has inspired hope in our schools!

Blog post written by:
Jenny Ventura, Director of Model Implementation and Assessment
Jenny Ventura, Director of Model Implementation and Assessment
 RSS Feed